Hello, FollowFox community!
Link to the repo for those who just want to see and use the code: link.
Today we want to share a tool and a workflow that saves us a lot of time when generating a bunch of XYZ comparison grids when testing new models and comparing many checkpoints. While it can be done with Auto1111’s WebUI, the process is inefficient, so we will utilize its API to make it more efficient.
tldr: We've devised an automated workflow that makes generating XYZ comparison grids for comparing SD checkpoints less painful, replacing the inefficient process via Auto1111’s WebUI with a more streamlined approach using its API. This workflow can save hours, particularly for heavy testing cases. Feel free to skip ahead to the 'How to Use It' section to get started with this method without additional context.
Heads up - this is a very specific workflow for heavy testing, and in most cases, this is not needed; the WebUI is more than enough for everyday use. But our approach can save you much time when you want to do heavier testing.
This post can be interesting for you for a few reasons: maybe for this particular use case, or it can be a good intro to WebUI’s API, or you might have other workflows that can become more efficient by slightly modifying our script.
This post can be interesting for you for a few reasons: maybe for this particular use case, or it can be a good intro to WebUI’s API, or you might have other workflows that can become more efficient by slightly modifying our script.

Efficiency God Cat, by Vodka model series.
Overview
We train and fine-tune a lot of Stable Diffusion models. Mastering that process is interesting and important, but one can only do this well if the results are appropriately analyzed and tested. The range and amount of tests we do have been growing over time, and we have reached the point where the testing part of the models has become our bottleneck. It requires a lot of time and discipline, and generating comparison grids is boring.
We have been relying on Automatic1111’s XYZ plot script for this purpose. It is a powerful tool that allows comparisons across models at different settings instead of generating images individually. But its not perfect - mainly because 3 dimensions is not enough.
To give you a sense of what type of testing we usually do - our typical setup on XYZ plot is different models on the X axis, several seeds on the Y axis to not rely on just one image, and a few CFG values on the Z axis. On top of this, we like to test different prompts with their corresponding negative prompts and parameters, such as the number of steps and samplers.
This means we need to input details for every XYZ image manually, wait until each plot is finished (a few minutes typically, depending on settings), and then set up the next plot. This easily turns into a 2h+ process for each test.
So we decided to introduce a bit of automation here.
The New Workflow
In theory, everything we are doing here can be a new extension on WebUI (maybe it already exists? Please point us to it).
We generate a CSV file where each row represents an image grid. So each row has information about prompts, negative prompts, which models to compare, and all other parameters. Each row can be as custom as you wish.
Then, we created a simple script that reads this CSV file and feeds the parameters for each grid to Automatic1111 through the API. So instead of two hours in front of the computer inputting prompts and parameters in WebUI one by one, we can now launch the script, leave it for those two hours and come back to review all the grids generate.
It’s important to note that this process has one big downside being unable to review the generated grids after each generation to adjust the next tests accordingly. Not ideal, but acceptable if you have a somewhat good or standardized approach to testing.
How to Use It
For a start, here is a detailed guide on installing and using the script. We will write about how the script was made and example use cases later in this post.
You need the ability to launch Automatic1111 WebUI and the ability to launch Python scripts. You can use whatever installation you have and can be local or cloud services.
In our case, we are using our WSL2 installation, and if you want to copy the setup, here is our detailed guide (link).
Once those prerequisites are met, we can start setting up the script.
Copy the Repo and Set it up
Decide where to set up this script and go to that folder. Then run the following commands:
- Clone our script by running the following:
- git clone https://github.com/irakli-ff/auto1111_xyz_plots_api.git
- That will create a folder called auto1111_xyz_plots_api. go there by:
- cd auto1111_xyz_plots_api
- Install requirements:
- pip install -r requirements.txt
Prepare the inputs file
In the cloned folder, you will have the inputs.csv file. That files will contain all the details about your generation, and thus that’s what you have to modify to define prompts, negative prompts, checkpoints you will be testing, and so on.
You can edit the CSV file with whatever tool (excel, code editor, etc.) you like. In our case, we used Google Sheets for collaborative reasons and are providing the exact template for you. (link).
How to edit it:
- Column 1 is Test Name: this doesn’t impact the generation, but this is how your files will be named. Use something intuitive to recall what you generated.
- Column 2: prompt. No explanation is needed.
- Column 3: negative prompt. You can leave it empty or enter the desired prompt. You can also do the same prompts across different rows and slowly modify negative prompts to watch how it evolves your images
- Column 4: Sampler. No explanation is needed, but be careful; some are slower than others and can greatly impact the overall generation.
- Column 5: steps. number of steps for each generation. This can impact the overall time required quite significantly.
- Column 6: checkpoints. This will be your Y-axis in the generation. Follow the formatting in the provided template. It’s a comma and space-separated list of checkpoint names. Names include extensions but no hashes. Note that all these checkpoints must exist in your Auto1111 installation. Our example:
- Column 7: seeds. This will be your X-axis in the generation. Seed numbers - you need at least one and can have as many as possible. Please note that we haven’t tested the -1 value, so be careful.
- Column 8: cfg values. Similar to seeds, you will need at least one value. This is used as a Z axis for the generation.
Once done, save the file as “inputs.csv” in our installation folder.
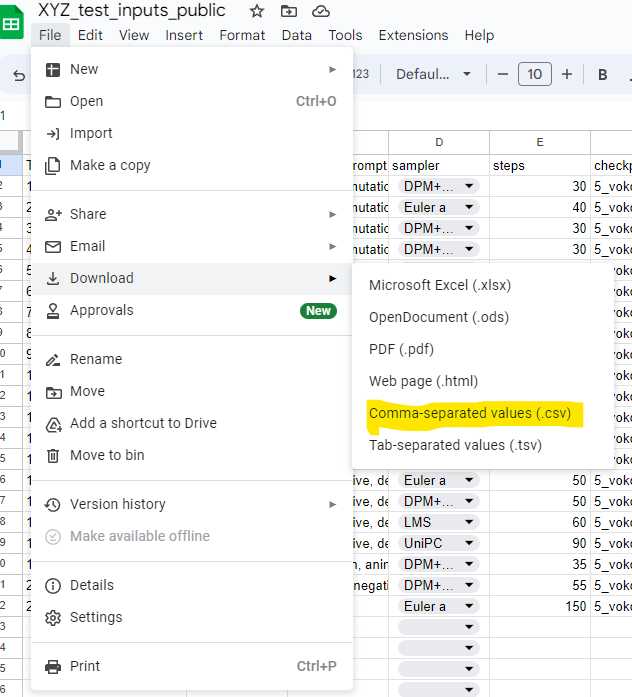
If you use Google Sheets, copy our template to your drive, edit it, and press File→Download→Comma-separated values (.csv). Rename the downloaded file to inputs.csv and place it in the installation folder.
Launch the Process
Now we are ready to launch everything, sit back, and save some time:
- Launch Automatic1111 with API enabled. In our case:
- python launch.py --xformers --api
- Navigate to the folder where you have the script installed and launch the following command (with cmd, WSL, or whatever you use):
- python api_tester.py
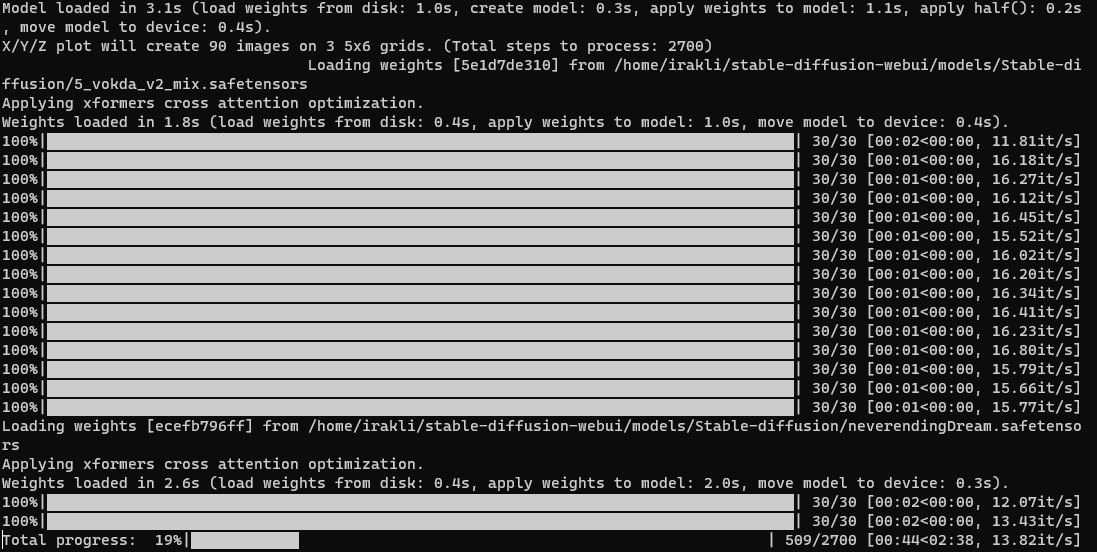
- If all goes well, your generation will start, and output grids will be individually added to the output folder.
Note that the Jupyter Notebook version is inside in case you can and prefer to run the script that way.
What’s Inside and How to Modify It
The whole thing is very basic and simple. It uses Automatic1111’s awesome API to automate the workflow.
You can check the documentation on the API if you want to make edits and upgrades to the script. To do so, launch your automatic1111 installation with API enabled and then visit http://127.0.0.1:7860/docs. Note that the API part is a bit more complex, so ignore this paragraph if you are not planning to make significant changes.
The system consists of two main files: payload.json and the script itself.
The payload file contains all the parameters fed to Auto1111’s API. These are default or starting values.
Then the script takes the inputs from the inputs.csv file, modifies the payload accordingly, sends the modified payload to API one by one, and finally saves the generated image grids in the outputs folder.
Example of How to Use the Script
In our last post (link), we wrote about how we made our Vodka V2 model (link to Civitai).
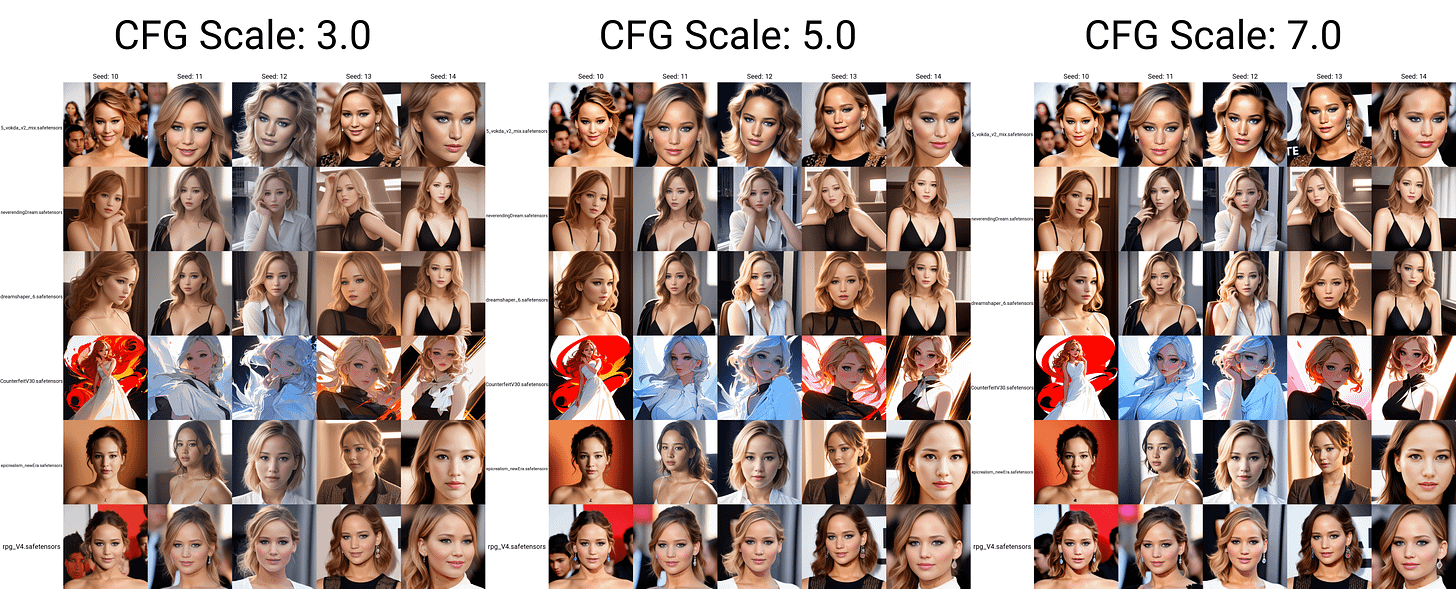
And since it has been getting some traction, we decided to benchmark it against the popular base, trained models. (note that we are not using mixed models here, as we think the base alcohols comparison process differs from comparing cocktails).
We created 20 different prompts and combinations of parameters that we wanted to test and input all of them in the inputs.csv file.
The prompt set includes classics like ideas from this post (link) to different popular prompt styles across Midjourney, civitai, and other resources.
We chose five awesome models to compare to:
Thousand of images were created to show how much time it saved (as if we didn’t need to stay at PC and manually input each prompt) - the generation started at 9:40 am and finished at 1:27 pm. That’s almost four hours!
We will not write about our findings here, but the process can teach you much about your and other models. You can start to notice biases, strengths, and weaknesses. You can start guessing the data and methods used to train different models.
We have uploaded the files to our model card on HuggingFace (link) if you want to see all the comparisons.
Hope you enjoy the post and find this useful. As usual, please share your thoughts and feedback with us.
Hope you enjoy the post and find this useful. As usual, please share your thoughts and feedback with us.
